
Yield prediction for arable crops in Germany based on Sentinel-1 SAR data
For a farm in Thuringia/Germany, we have developed a model based on historical yield data and ESVI (enhanced SAR Vegetation Index) that enables the yield to be reliably estimated. Sentinel-1 satellites deliver data regularly every 12 days worldwide with a resolution of 20x20 m. The ESVI is based on this data and can be seen as a proxy for fresh biomass. SAR data are independent of daylight and atmospheric disturbances and are therefore ideal for time series analysis. In this evaluation, we used yield and satellite data from all years 2018 - 2022.
Data: Zonal statistics were created for all individual plots, all years, and for each acquisition date, which resulted in the mean value, the maximum, and the minimum being extracted from the respective ESVI data sets.
This data was then compiled in data tables and compared with the yield data for the respective years. Yield data results from weighing logs captured after harvest.
Method: For the modeling of the yield values, 5 consecutive ESVI datasets were used. The same formula was used for all cultures and all years.
The formula depends on a weighting table for each crop-type, which is valid for all years. Depending on the weather conditions, the start of the season may be delayed by a few days. The model allows a corresponding adjustment if it becomes apparent that the growth phase in the current year will start much earlier or later than in ‘normal’ years.
The evaluation in the graphic below, for one plot and one year, shows a slightly thicker green line. It represents the mean value of the individual plot. The line is flanked by 3 other lines showing the mean value over all plots of the same crop-type and the same year. In addition, you see the simple standard deviation around the mean as a confidence interval. The two gray bars indicate the period for which the yield modeling was calculated in this example (early March – mid-April).
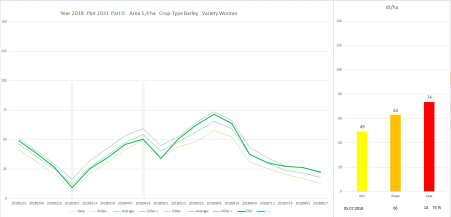
On the right-hand side you can see the modeled yield values for the individual plot (minimum, mean and maximum) in the bar chart and below that the harvest date, the measured yield and the moisture content in the grains.
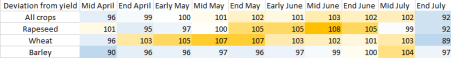
Results: The tables for every single year can be seen in Annexes 2-6. In the header of each table you can see the acquisition dates on which the last of the 5 succeeding ESVI datasets were used for yield modelling. The table shows the deviation of the modeled yield/ha from the measured yield/ha. A value of 104 in this table means, that the model overestimated the yield by 4 %.
In the first line of each table you see the deviation of the modeled yield from the mean ESVI value over all plots of the same crop-type and the same year.
Plots with relatively low yield values but high ESVI values were massively overestimated. However, it is also possible that the assignment of yield per plot data, in the logistic chain or the weighing log was not always without errors. On average over the entire farm, the results are surprisingly good.
In the following table you see an aggregation over all five years. The result from all years, all plots and all varieties show a result close to 100% compared to the measured yield. Yield prediction can be done from early April and with high reliability from early May to mid of June.
Overall, it can be said that the model seems to be stable over the years. Even if individual plots stand out as outliers, the average over all plots of one crop type is close to the measured yield.
The standard deviation indicates, that yield prediction between early and mid May, for each single crop and over all crop-types deviates from the real yield in 2 from 3 years by less than 10 %. Only in 1 from 20 years it can be expected, that the predicted yield deviates by more than 20%.

Based on this data, a farmer can plan at an early stage how much storage capacity is needed or how much of his predicted yield he can sell in advance into the market.
Various applications based on yield estimation can be seen in crop insurance and agricultural trading.
Considering the current situation in Ukraine, a reliable and early yield forecast would be important for the entire logistics chain right down to the end consumers.
Implementation: The software enterprise ESRI built an application where the algorithm for the yield prediction is already onboarded. The tool allows the farmer to select single plots or all plots of one crop-type to calculate the yield prediction for the actual year, based on the map product ESVI. Customers who register for that service have as well access to other map products from the same sensor like SWI (SAR Water Index), which is useful to monitor drought condition in cropland. Within ArcGIS online they can easily apply seasonal and annual change detection on-the-fly.
The data will be actualized according to the acquisition schedule of Sentinel-1 with a delay of less than 48 hours and is later available in the online platform ArcGIS Imagery
iMap| software that moves us 2/2
Download the PDF version: