
Category: Uncategorized

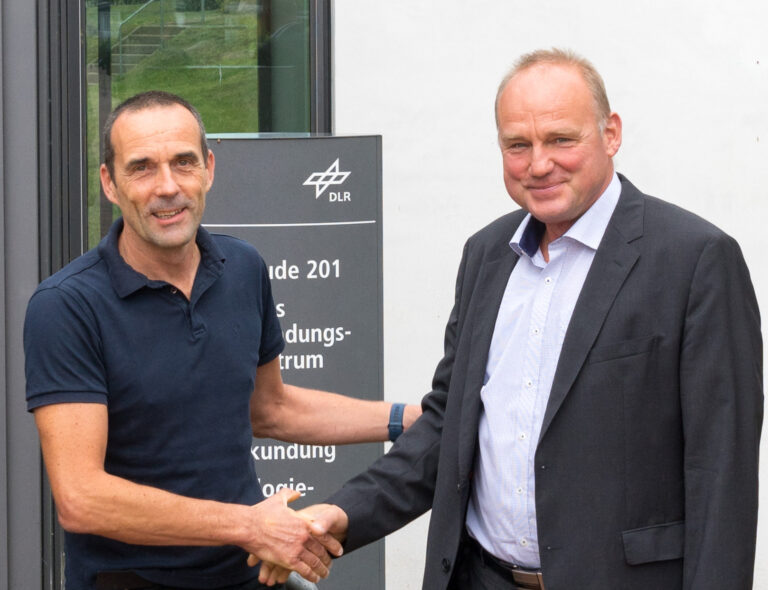
GAF AG: 25 years of successful cooperation between GAF AG, DLR and Antrix
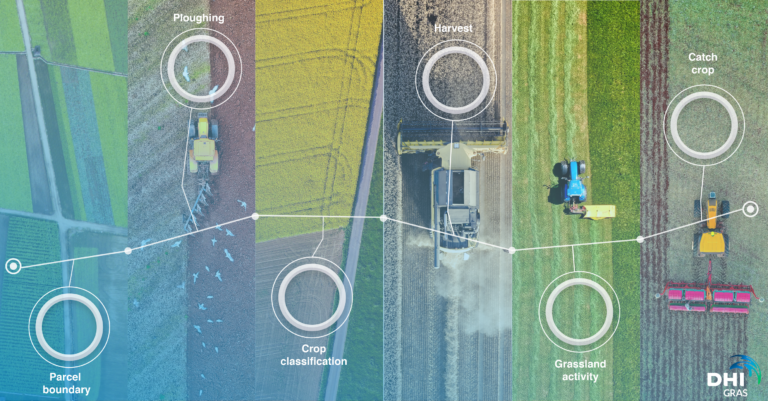
DHI GRAS: A PRIZE-WINNING PARTNERSHIP AND FRONTRUNNER OF SATELLITE-BASED AGRICULTURAL MONITORING
How does the PARSEC journey support EO innovation?
Innovation fuelled by Earth Observation
An immense opportunity for the development of innovative services and products has opened up: the advent of the Big Data era, spearheaded by Copernicus’ free, full and open data policy and galvanised by the emergence of new business models for exploiting Earth Observation data.
In order to benefit from this opportunity, start-ups and SMEs need four basic elements: access to capital, knowledge, markets and technology. Starting in May 2019, the PARSEC project set out to make these resources much more accessible through a holistic acceleration programme alongside coaching, training and market entry support.
Since then, the PARSEC Accelerator has enabled the transformation of innovative ideas into market-ready products that bring significant value to users in the food, energy and environment sectors. 100 winners of the first Open Call received a small cash injection of 10K, and 15 winning teams from the second Open Call have benefitted from a substantial grant of 100K.
PARSEC is supporting the optimum exploitation of EO data and services in support of the implementation of regional smart specialisation strategies and the increased competitiveness of EU companies on the international stage.

Faster, Higher, Stronger
Becoming a market champion in the Earth Observation context implies being able to quickly analyse vast amounts of data, develop services of great value and bring them to as many customers as possible. To help boost these capabilities, PARSEC set up three Large Scale Demonstrators, known as the Business Catalysts:

The Big Data Toolbox: A suite of resources helping companies to harness the power of big EO data.

The In-situ Data Hub: A store-house of non-space data that can enhance or validate EO products.


eoMALL Galleries and eoPages: These portals act as a “window to the market” for solution providers.
The Business Catalysts were developed by innovative SMEs within the PARSEC consortium. Beyond facilitating the acceleration process of new marketable solutions, the “business catalysts” developed in PARSEC will help the greater Earth Observation community to achieve the motto: “Faster, Higher, Stronger”.
As part of the legacy of PARSEC, these tools will come to complement the technology provided by the Copernicus DIAS platforms. They will support the business models for future EO-based innovation, including – but not limited to – the solutions commercialised through the PARSEC Accelerator.
Let the ideas take flight
After a fierce pitching competition, an independent jury of experts selected the most promising 15 teams representing cross-border and/or cross-sectoral consortia (#15PARSEC). The teams were awarded 100.000€ each in equity-free funding, and can enjoy the support of PARSEC’s second stage business services to help them see their innovations enter the market, until the end of the project in December 2021. Here are the 15 winning solutions!
 | Providing actionable intelligence for development planning and investment Village Data Analytics Energy, Food, Environment |
 | Crop Predictions Take Flight xseedscore Food |
 | Global oil pollution intelligence OKEANOS Energy, Environment |
 | Snow information for Hydropower SNOWi Energy |
 | Automated cotton insurance Cottonsurance Environment |
 | Preventing illegal fishing Copernicus Blue Environment, Food |
 | Optimizing navigation routes with precision polar fisheries POLARIS Food |
 | Space application for detecting Aedes mosquito risk areas Dipetron Environment |
 | Monitoring carbon uptake of forests from space Foresight Carbon Environment |
 | Integrated planning for climate resilient and energy renewable cities The Century Project Energy |
 | Observing and understanding the environment ScyscrApp Environment |
 | EO and long-range drones combined solution for power line inspections. Rom(EO) Energy |
 | Air Quality-Based Urban Routing and Information HealthyPlaces Environment |
 | EO-Based Digital Chemical-free Plant Protection System IO3T Food |
 | Pest and disease warning and prediction platform for horticulture Space4Fauna Environment |
On the Horizon
We are examining options for the future of the accelerator beyond the end of the project, and are seeking ways in which we can continue to support the development of EO-based products and services, enabling access to finance, knowledge, markets and expertise.
Are you interested in future partnership? Let us know here and we will contact you shortly.
Follow us, as our journey continues, with our next flagship event, presenting the results of the PARSEC Accelerator, in December.
Twitter: @PARSEC_EU
Facebook: PARSEC Accelerator
LinkedIn Group: PARSEC Accelerator
For further information
Project Coordinator
Mr. Emmanuel Pajot
email: emmanuel.pajot@earsc.org
Tel: +32487743569
Project Manager
Mrs. Weronika Borejko
email: weronika.borejko@earsc.org
Tel: +48663881993
The PARSEC project has received funding from the European Union's Horizon 2020 research and innovation programme under grant agreement No 824478.
Industry Profile Autumn 2021 – Geocento

Tell us a bit more about your company
Our mission is to help both earth observation businesses and other markets to grow taking away complexity of imaging and providing easy, timely, and cost-effective access to satellite and airborne data. We enable this through our unique combination of best-in-class platform technology, extensive range of image sources, combined decades of years of Earth Observation market expertise, and independent and committed customer support. To date, we have provided imagery solutions to customers across 59 countries, and have implemented 20 R&D projects. Geocento was founded on December 1, 2011, so we will be celebrating our 10-year anniversary in a few weeks!
What makes your services and products unique?
As a user of imagery, you should not have to identify and compare providers, navigate their complex range of products and services and commit money to one supplier before knowing that their data is the most suitable, or whether the data can be collected successfully. You should have a simple way of being able to select and access imagery without being some kind of earth observation expert with a detailed grasp of jargon, technical specifications and the latest order parameters! You should have a simple way of identifying what you want, ordering the most suitable product or service, and then receiving it, all through the same platform! That is why we have developed EarthImages – the industry platform of choice for discovery and ordering of imagery from a market-leading range of image suppliers. Currently, it provides access to data from 87 satellite sensors… or more than 230 if we include Planet’s fleet!
With EarthImages, you can access a broad range of imagery products from commercial ultra-high-resolution optical 15 cm HD, SAR, hyperspectral, night and video to non-commercial data sources (which we provide “for free”). This is unique – no other industry platform offers all this in one place! And it is not only about the vast sensor portfolio. EarthImages is a powerful application that allows you to manage and use your imagery in one place. For example, you can keep a track of your orders, configure and compare image plans, and share imaging campaigns across multiple users and organizations. Your project team can be involved in evaluating and selecting imagery. Online license signing, choice of payment methods and simplified delivery are standard. Furthermore, you can render your imagery directly and store it securely in the platform. There is no need to download and embed it into another application. If you create your own algorithms, you can host them on our platform and apply them to your data, avoiding the need to "take the imagery to the algorithm". To display results using our map client, you just need to copy and paste the URL – and you have them added to your environment. The full range of capabilities of EarthImages can also be integrated into your own operations using our convenient API tools, or can be customized as a white label web application.
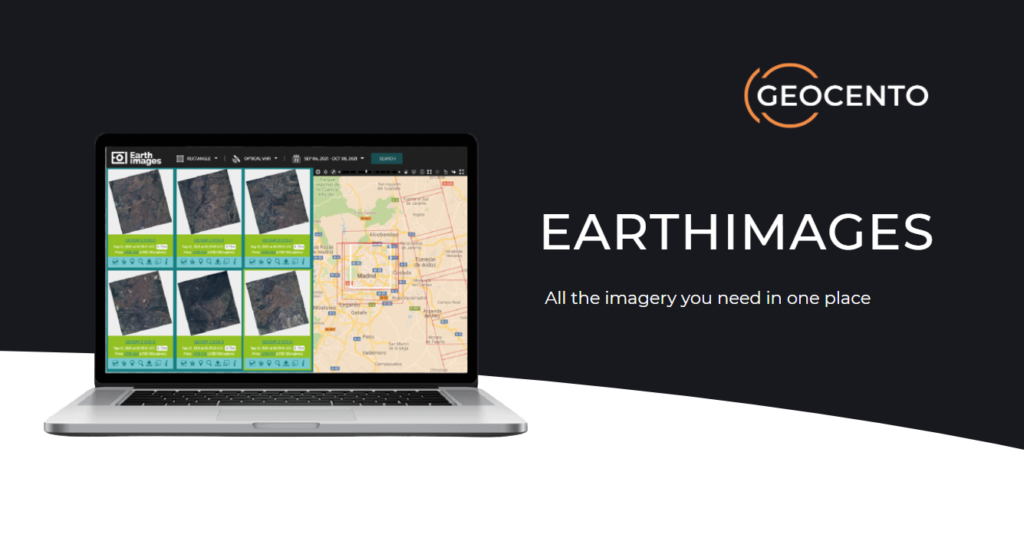
It is worth adding that we provide consulting and support clients at each stage of their imagery journey: from clear definition of business needs to operations and staff straining. You can access the open version of EarthImages free of charge here. Please contact us if you require advanced tools and would like to discuss enterprise solutions.
What are your future plans for the company and your products?
Currently, we are working on an ambitious and very exciting service called EarthImages-on-Demand. This service is all about fresh collection of imagery that puts the customer in control, with competition between suppliers driving
standards for the benefit of the market. A user simply specifies what he or she wants, when and where. The request is then broadcast to all relevant suppliers in real time. All relevant suppliers receive the request and respond according to their imaging capacity. Money is committed but no payment is required unless and until the order is completed to full specification – we provide quality control. The whole collection process is managed using a shared image acquisition plan that enables suppliers to make informed decisions on collection while the user is kept informed of progress. As you can see, it is designed to be very easy and user-friendly! We would love to hear from early adopters who wish to benefit from using EarthImages-on-Demand before its commercial release. Please send us a request if you have a possible pilot project, or just wish to find out more. You can find more information here.
Sounds exciting! Can we join you?
Of course! We are looking for multi-disciplinary talents to join our team in
Oxford, Madrid or remotely. Do send us your CV and cover letter to recruit@geocento.com
How can we contact you?
We are always happy to get in touch! Choose the most preferable way for you. Drop us an email:
Kim Partington, CEO: kim.partington@geocento.com
Thomas Lefort, CTO: thomas.lefort@geocento.com
Maryia Urazaeva, Sales & Marketing Director: maryia.urazaeva@geocento.com
Call us: +44(0)7833136019 or meet us in our offices at Harwell Campus near Oxford and in Madrid, or at industry events. Visit our website, and submit online form: https://geocento.com/ Follow and reach us out on social networks:
LinkedIn: https://www.linkedin.com/company/geocento/
Twitter: https://twitter.com/geocento
Updates of Japan Space Policy

Interview with Mr. Rodrigo da Costa, Executive Director, European Union Agency for the Space Programme – Summer 2021
- Could you tell us a bit about the EUSPA?; how the agency started, its mission and role in the Galileo programme, some examples of actions that have been taken and some success stories?
Space services have had an impact on economy and society since quite some time across a broad spectrum of industries from aviation and agriculture to maritime and surveying just to name a few. With this in mind, the Commission and the co-legislators (Council and European Parliament) decided to bring the EU space assets under one roof with the creation of the first ever integrated EU Space Programme and the establishment of the European Union Agency for the Space Programme (EUSPA). EUSPA will become a pillar for Space Programme ensuring the implementation of the EU Space regulation to the fullest. This new agency has increased responsibilities in terms of the Galileo and EGNOS services but also undertakes tasks related to the promotion and commercialisation of the Copernicus data. EUSPA is also coordinating the development of GOVSATCOM, the EU’s secure telecommunications system for governmental users.
Since its inception, the Agency had been engaging with the EU space user community, designing, developing and implementing services that best meet their needs.
To stimulate space innovation in Europe and advance the market uptake of EGNSS we have been transmitting GNSS expertise and market development knowhow, leveraging grants, innovation competitions and R&D schemes to those wishing to make use of EU Space.
We have managed to create a blossoming ecosystem of SMEs, start-ups and academia using European Space technologies. Currently, thanks to our #MyGalileo series competitions, we have mobilized a network of 1000 start-ups, private inventors from all over Europe. This pushed the bar of innovation higher and yielded applications ranging from drone medical deliveries to beekeeping solutions and precision farming projects.
These competitions are part of our adoption strategy for Galileo and EGNOS.
Today, this led to some impressive results. Just to name you few:
- currently more than 2 billion smartphones are using Galileo,
- more than 3 million trucks use Galileo and EGNOS in Europe,
- 15 million cars use EGNSS worldwide and 9 million of those cars are in Europe,
- Already more than 100 car models on the market are fitted with Galileo and EGNOS solutions, which represents 29 car brands in total.
- 30% of drones use Galileo
- 30% of Maritime receivers are Galileo-enabled
Innovation and the support for entrepreneurship is at the heart of our strategy and we are planning to continue to support it for Copernicus downstream development.
- The EUSPA has been asked to take on an expanded role to help develop the uptake of Copernicus. How would you describe this new mission?
We’re very excited to have Copernicus onboard for this new EU Space journey. Copernicus is the world’s most advanced Earth Observation system offering a dearth of value-adding services to a growing group of users around the world. EUSPA is in charge of developing downstream commercial applications and markets for Copernicus, fostering innovation, leveraging funding mechanisms such as Fundamental Elements and Horizon Europe. We are already working together with the Entrusted Entities of Copernicus to ensure that all the markets are reached and that commercialization of Copernicus data are bringing added value for European companies and ultimately the citizens.
- How does this mission benefit from the existing role in Galileo? How do you see the similarities, synergies and areas of distinction between your ongoing role for Galileo and the new role for Copernicus?
It is within EUSPA’s scope to forge synergies between the EU Space Programme components and therefore Copernicus. The synergies between EO services and GNSS services will help us develop a range of solutions for various business sectors but most importantly they allow us to respond to societal challenges such as preserving our ecosystem. Let’s look at maritime protection for example. Oceans produce over 50% of the oxygen we breathe and regulate the climate. They are vital for human and animal life which is why they require constant monitoring and protection. And that’s where the synergies of Copernicus and Galileo are essential. The high positioning accuracy offered by Galileo when combined with high-resolution imagery coming from the Copernicus Sentinel satellites can allow authorities to identify and reach an incident site easily such as an oil spill and thus, mitigate its negative impacts. Likewise, we can fight illegal fisheries. I see these synergies as a way to democratize the services from space and also to drive progress in EU space. There is a lot of potential to be explored.
- How does this mission relate to the European Commission DG DEFIS? Can you describe the governance of the agency and especially in relation to Copernicus?
Working together with the European Commission and more specifically DG DEFIS as programme manager, ESA, the Entrusted entities of Copernicus and the Member States, EUSPA will be supporting the implemention of the the EU Space Programme regulation to the fullest. While the Commission remains the project manager of the EO programme, EUSPA is here to support its tasks and make sure Copernicus market share is increased the coming years.
- There is some confusion concerning a second space agency in Europe, how do you perceive your future relationship with the European Space Agency?
EUSPA is an operational user-oriented EU Agency contributing to sustainable growth, security and safety of the European Union. We are aiming at fostering the market uptake of the different space components (Galileo, EGNOS, Copernicus and GOVSATCOM) and is thus linking space to user needs.
EUSPA and ESA are complementary bodies with different responsibilities and different nature. EUSPA is an EU Agency although ESA is not an EU body but an intergovernmental body.
We will continue to work with our partner ESA because they are an essential partner to implement the EUSP.
- The political decision has only just been taken, how have you been preparing the agency for this new role?
Indeed, the political decision was made official only weeks ago by the European Parliament. Knowing earlier on -from December’s political agreement- that this is the direction we are heading to, we had started devising our new EUSPA strategy at many levels to ensure a smooth transition to our new responsibilities. I am proud that our teams at the Prague HQ but also in, Paris (Galileo Security Monitoring Centre, GSMC), Madrid (GSMC, European GNSS Service Centre, GSC), Toulouse (EGNOS) and Noordwijk (Galileo Reference Centre) helped rollout a new agency in a tight deadline. It’s a result of great teamwork and contributions from all EUSPA departments.
- What will be the main elements of the programme which you will put in place?
Our role regarding Copernicus is to promote and ensure the commercial market uptake of Copernicus data.
Under the new Space Regulation, however, EUSPA’s mandate will now include:
- increased responsibilities in Galileo and EGNOS, including enhanced management responsibilities for the operations and service provision;
- the security accreditation of all the components of the EU Space Programme, the operation of the Galileo Security Monitoring Centre, together with operational security;
- the coordination of the user-related aspects of European Union Governmental Satellite Communications (GOVSATCOM), in close collaboration with the Member States and other involved entities;
- the development of downstream markets and fostering of innovation based on Galileo and EGNOS, and now including also Copernicus, leveraging funding mechanisms such as Fundamental Elements and Horizon Europe.
The European Commission (EC) may also decide to entrust the Agency with other tasks in the future.
- In your opinion, what will be the best mechanism to build a strong partnership with the EO services industry and how can EARSC help? / At the end of the interview, here is the opportunity for your final thoughts and how your activities could contribute to the future development of the EO geo-information service sector?
Knowledge and information about the EU Space Programme and the possibilities it offers are key to further reinforcing the EO downstream sector in Europe. As the agency’s scope has been enlarged, we will be looking forward to introduce ourselves to the EO industry and communities by participating in industry-relevant events as well as promoting EUSPA’s contribution to the commercialization of Copernicus through various online and offline channels. Already last year, during EU Space Week, we hosted a great number of EO companies in our virtual exhibition. I look forward to seeing these integration actions for EU Space grow.
What’s more, to stimulate the market update of Copernicus, we will be establishing partnerships and continue initiatives like hackathons and innovations competitions. I am sure EARSC, as representative for remote sensing companies will give us great support in our new ventures.
Lastly, I would like to highlight the fact that the EU Space Programme was conceived with the core aim of benefitting the lives of Europeans. I understand that the knowhow of EO and GNSS is not equally spread across the Union members. This is one of the challenges we will overcome the coming years and we have the tools and talents to do so. By working closely with all the EU Member States, EUSPA will give SMEs, start-ups, innovators the means to make their first venture into the world of EO or satellite navigation.
Thank you for your contribution to the Interview and for sharing your thoughts and comments with the EOmag readers.
Industry Profile Summer 2021 – Aerospacelab
Aerospacelab
- Tell us a bit more about your Company
Aerospacelab was founded in late 2017 near Louvain-La-Neuve in Belgium by Benoit Deper and recruited its first employees in 2018.
From the very beginning, Aerospacelab has set itself the goal of becoming the European leader in actionable intelligence based on satellite data and other sources. Seizing the market opportunity offering lower costs in satellite manufacture, launch and data storage with larger server capacity for data, Aerospacelab based its business model on a fully vertically integrated intelligence solutions. Its overall mission is to enhance efficiency across markets by making geospatial intelligence both actionable and affordable.
To match its ambition, the company now employs around 70 people from 17 different nationalities with a distinct focus on the future through our many young employees.
- What makes your services and products unique?
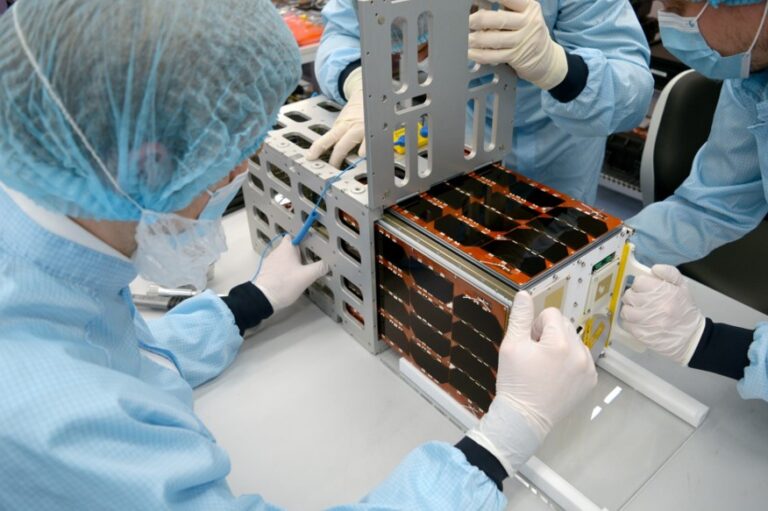
Aerospacelab follows a vertically integrated strategy, developing expertise both in upstream and downstream. We design and manufacture standardized microsatellites with flexible payload, operate constellations of satellites to generate data, and develop processing toolchains to extract and deliver actionable insights to end-users across various sectors.
We are also unique in the way that all of our services are designed to leverage data fusion and synergies between constellations. One example of this would be our ability to detect an event and task our satellites to zoom in on it with various instruments collecting different types of data. Our rationale is that we don’t base our solutions on just one type of data but we plan on combining the different sources. It would be like piecing a puzzle together : only once complete, can we fully understand the whole picture.
- What are your future plans for the company?
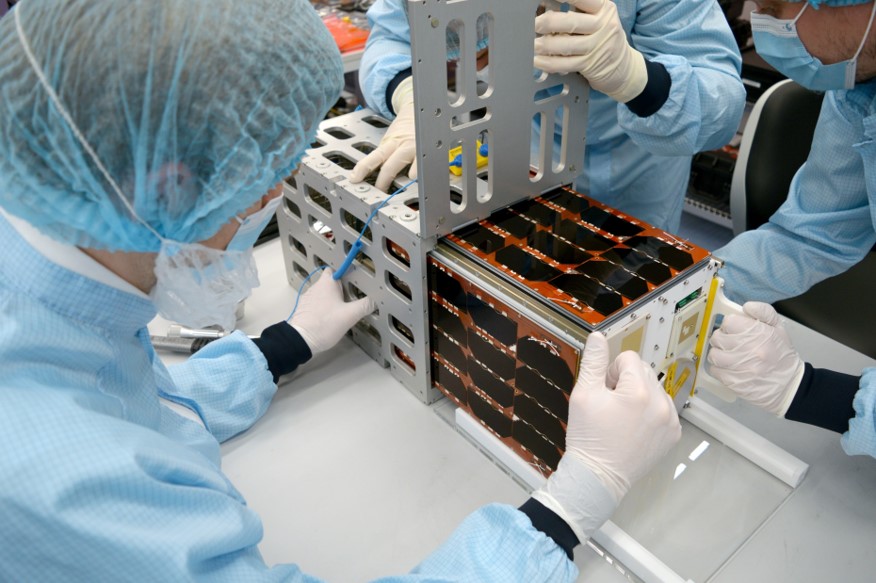
We have an exciting milestone just ahead of us : We’re preparing for the launch of our very first satellite by the end of June ! Our Risk Reduction Flight (RRF) mission will aim at de-risking and testing the technologies and operational processes developed in-house. We’re also making a bit of history with this satellite because it is the first 100% Belgian privately developed, funded and operated satellite that goes into orbit. And it’s going to be quite a show as it will be launched on a Falcon 9 rocket for SpaceX’s Transporter-2 mission !
We have yet another thrilling launch coming up at a later date with our Proba-V Companion Cubesat (PVCC) in its production phase at ESA. Meanwhile, we’re also working on our satellite constellations and our Versatile Satellite Platform (VSP) production site in Louvain-La-Neuve scheduled to drastically ramp up production starting next year.
On the downstream side, we’re partnering up with a number of different private companies to develop solutions in the form of a tailored dashboard that equips them with actionable insights. We’re offering these solutions in a vast array of sectors such as economic intelligence, insurance, environmental monitoring, support to operations, ESG and defense.
We also have a few more very interesting projects up our sleeves for a not so distant future…
- Sounds exciting ! Can we join you ?
Of course ! We’re scheduled to recruit at least twice as many people as we currently are in the next couple of years ! We’re looking for all kinds of profiles : from engineering (hardware/software) to business. Check out the different opportunities on our website : https://www.aerospacelab.be/join-our-team/ and don’t forget to follow us on our social media to witness our path to ever bigger things :
Linkedin : https://www.linkedin.com/company/aerospacelab
Twitter : https://twitter.com/aerospacelab_be
Facebook : https://www.facebook.com/aerospacelab.be
Editorial Summer 2021
Editorial by EARSC's Secretary General Emmanuel Pajot
2021 New horizons for the EO downstream sector!
After several quarters without any update, we are delighted to revive eoMAG, EARSC’s newsletter, to keep you updated on the EU EO downstream sector.
2021 first semester was marked by several moments which will drive the future of our dynamic sector. In March, Josef Aschbacher, Director of Earth Observation since 2016, was appointed ESA Director-General. The following month, the European Council adopted the European Space Programme 2021-2027 budget of 14,88 billion. In May, the European Commission created the new European Union Agency for the Space Programme “EUSPA”. EUSPA’s mandate includes increased responsibilities in managing the exploitation of Galileo and EGNOS and is also responsible for the development of downstream markets and fostering of innovation based on Galileo, EGNOS and the commercial users of Copernicus.
EU companies will get access to a set of actions such as the European Commission’s new initiative Cassini to support innovative entrepreneurs, start-ups and SMEs in the space industry (first information on EARSC Youtube channel – link) and Horizon Europe programme. With a total budget of 95.5 billion, Horizon Europe is the EU’s key funding programme for research to tackle climate change, help to achieve the UN’s Sustainable Development Goals and boost the EU’s competitiveness and growth. It includes an ambitious partnerships approach with industry in support of EU policy objectives. Many opportunities make references to Copernicus and EO at large. First calls opened end of June. EARSC can play a role to support your consortium, helping you to find a partner.
In June, the EARSC annual event “ExpandEO” took place, attracting 830+ people. During 2 days and 13 sessions, attendees had the opportunity to interact with the 70 speakers, explore the 40 virtual stands, and network. This year, ExpandEO attendees could have a concrete impact on the DG RTD Strategic Roadmap design during the 1st Fire Forum, pinpointing opportunities for EO uptake in six sectors: agriculture, wind energy, infrastructure, marine, raw material and urban development. Explore the ExpandEO website to get access to videos and discover the winners of the awards.
As a termination of this editorial, I want to share with you two opportunities:
- to develop your business in agriculture or maritime market in Chile or Australia: get support with the EARSC lead project ConnectEO: Call for participation in trade mission (https://fr.surveymonkey.com/r/TBYLK5N )
- to be part of EUROGEO’s flagship project in developing new services in alignment with the three main priorities of GEO (the Sustainable Development Goals, the Paris Agreement and Sendaï Framework): The second e-shape onboarding call is open up to September 3 (https://e-shape.eu/index.php/on-boarding-call )
I wish you a lovely summer and see you in 3 months for the future eoMAG!
rasdaman Receives US TechConnect Innovation Award
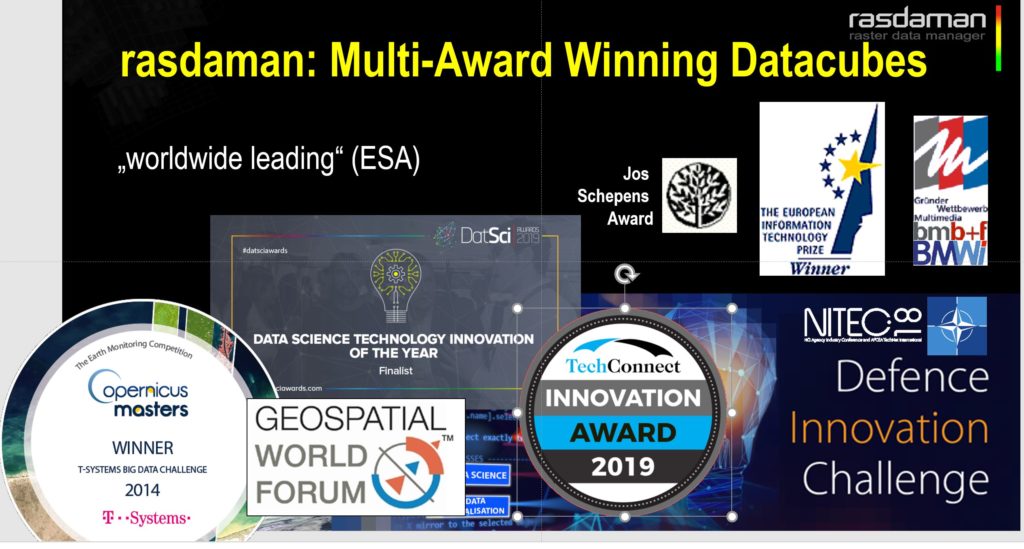
Every year, the innovation award is a highlight of the TechConnect event in Boston, USA. This year, the rasdaman datacube technology received the prestigious award from the industry prospectors looking for breakthrough technologies.
The TechConnect Innovation Awards identify the top 15% of submitted technologies as ranked by the TechConnect Corporate & Investment Partner Committee. Innovation rankings are based on the impact the submitted technology will have on a specific industry sector. Innovations are submitted globally, ranging from academia over government and corporate research laboratories to small and large industry.
The TechConnect Innovation Award, highlighting top industry vetted technologies, attests that rasdaman heralds a new generation of services on massive, distributed spatio-temporal data standing out through its flexibility, performance and scalability, security, and open standards.
"We are proud about this leadership acknowledgement expressed by TechConnect Boston", says Peter Baumann, Principal Architect of rasdaman and CEO. "The continuous line of innovation awards, such as the NITEC Innovation Award 2018, is a strong incentive for the team to maintain its strong pace of innovation."
For over 20 years the TechConnect World Innovation Conference and Expo has connected top applied research and early-stage innovations from universities, labs, and startups with industry end-users and prospectors. TechConnect has published over 10,000 technical papers, connected over 20,000 innovations with industry partners, provided prospecting to most all Fortune 500 technology companies, and supported most every U.S. Science and Technology agency since its inception.
More information: